
Workbook

exercise 14.1
Write a script able to create a table on multiple A4 pages describing an arbitrary sequence of Unicode characters. Each line of the table should report binary, decimal, and UTF-8 hexadecimal representations. Also, the line should render the character itself surrounded by two pipes “|” in gray and a description of the character according to the Unicode standard (check the unicodedata module). Here you can check a PDF example. Table header (in bold) and page numbering would be a nice to have, don’t you think?

exercise 14.2
Draw a multiplication table. You should be able to define the first and last values of the range of multiplied numbers (from 1 to 10, from 10 to 100, and so on). Then, extend the program capabilities in order to compute many different operations like addition, difference, power of, and division. Check the operator module for some hints. With different operations, you will probably face very large numbers or numbers with a decimal part. In the first case, scale down the type size if the number does not fit the cell size, in the other case use some tools from the fractions module mixed with OpenType features to typeset numbers like 0.333333333 in a compact way. Here is a an example.

exercise 14.3
The following exercise consists of typesetting a color table. This CSV file contains a collection of hex values followed by a name; it is compiled from this Wikipedia colors list. Your table should show a color swatch, the name, the HLS value, the RGB value, and the hexadecimal value. You are free to choose the page format, but the data should spread automatically over as many pages needed. Each page should have a header describing the content of the columns. Here you can find a PDF example.

exercise 14.4
Choose four colors and assign them to the canvas corners. Draw one or more donuts, each donut stroke color should be influenced (aka interpolated) by the canvas corners colors. You can either use arcs (and color them separately) or clipPath over a gradient.

exercise 14.5
Plot a collection of random locations on the canvas. Calculate the mean for x and y axes. Represent the values using colored lines. A caption with the mean values would be a nice addition. The statistics and random modules can come in handy

exercise 14.6
Draw a watch. Choose an iconic design you like and reproduce it. Or, just imagine a new one. The program should represent the time at runtime. You can use the datetime module for it

exercise 14.7
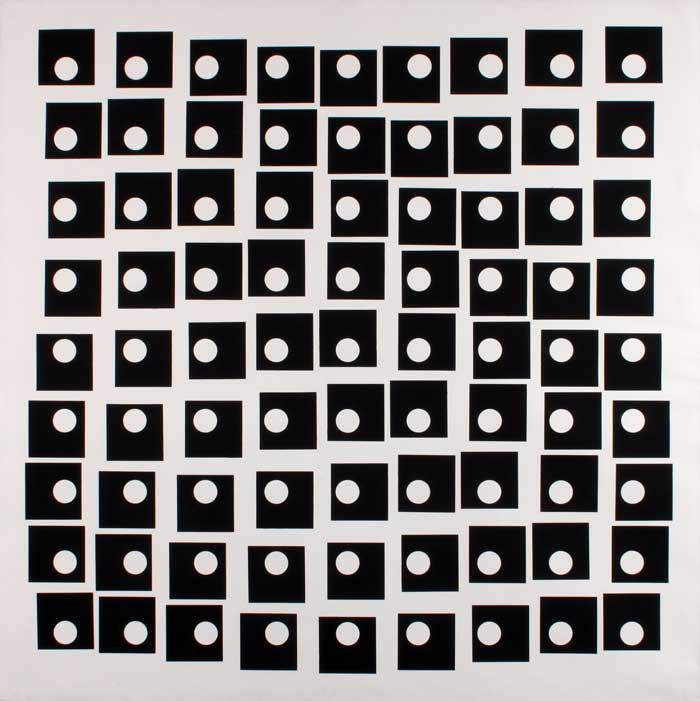
Try to emulate Julio Le Parc's “Séquences progressives ambivalentes”. Draw a grid of black squares evenly distributed on the canvas. Superimpose a grid of circles filled with the background color. Animate the squares grid harmonically using sin() and cos() functions. In the original work, the circles did not move. How would you organize the code to animate them too? Export a looping animation in gif and mp4 format.

exercise 14.8
Draw a protractor. Do you remember that plastic thingy used to measure angles in technical drawings made with paper and pencil? No clue? Ok, google it. Measurements in degrees and fractions of π. Extra: why don't you show an arc measuring one radian?

exercise 14.9
Draw a matrix of glyphs from a UFO file. Spread the glyphs evenly over the canvas and show metrics – horizontal and vertical –, baseline, glyph name, and Unicode in hexadecimal form. You might want to check the cookbook for some help. Here’s a PDF example

exercise 14.10
Choose a font you like. You can pick an open-source UFO file, use your drawings, or ask a type designer friend for some unreleased cool stuff. You can access the font data using fontParts, a Python module shipped along with the drawBot application. Once you managed to access the font data, draw a glyph on the canvas showing the underlying Béziers structure as if you were looking at the glyph in a font editor application. Subclassing a BasePen from fontTools – another Python module shipped along with the drawBot application – could make the solution easier to achieve. The cookbook could help a little bit. If you have never met a Pen until know, you might want to check this presentation
